Connected Nations Spring 2023: The Rural-Urban Digital Divide Continues
The latest Ofcom’s Connected Nations Spring update has been released, providing a detailed view of broadband and mobile coverage across the UK.
This includes a special focus on the increase in mass market gigabit-capable services (1,000Mbps), an area with a lot of activity, competition and the basis of current government targets.
One aspect that continually comes up is the concern that premises are being left behind by gigabit broadband upgrades and rollouts, and so we have looked at this latest data from Ofcom to analyse the variation in gigabit coverage in the UK.
In 2020, 7.9 million homes (27% of all UK homes) had access to gigabit-capable broadband. By January 2023, this figure has surged to 21.9 million homes (73%). Since the last Connected Nation report in September 2022, there has been a 3% increase from the previous levels of 20.8 million homes covered (70%). This growth has been possible through a combination of commercial deployment and initiatives by the central government, devolved administrations, and local authorities. Although an impressive increase, digging deeper into the data shows the variance across the country.
Nation Comparison
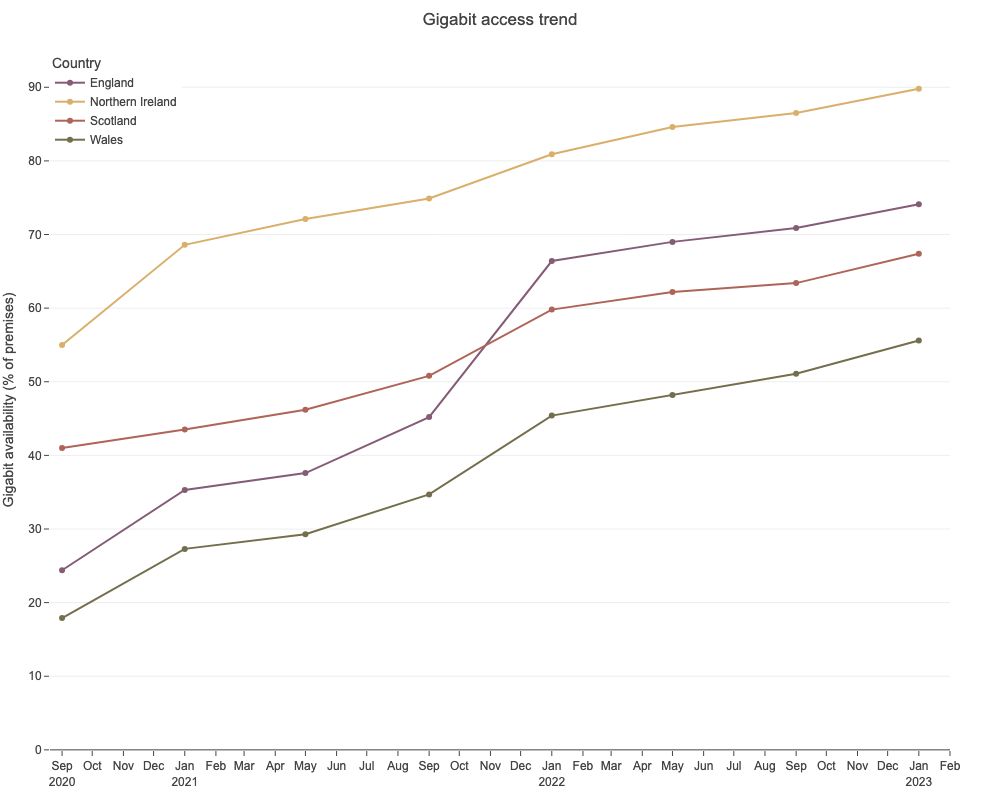
It is probably not a surprise that access to gigabit-capable services is not evenly distributed across the UK, but how big a difference is there between the nations? We find Northern Ireland boasts the highest percentage of gigabit premises with 90% coverage, while Wales lags behind at 56%. The chart below depicts the evolution of gigabit access in each UK nation since 2020, highlighting these disparities.
We suspect the large spike in coverage improvement in late 2021 was the result of Virgin Media O2 upgrading their cable network. The relative increase by nation shows the higher penetration of their network in England.
Local Differences
Taking a closer look within each nation, there are clear local-level differences in gigabit connectivity. For instance, metropolitan areas enjoy a greater share of gigabit broadband connection than other parts of the country, a result of factors like urban density, geography, and prior investment.
However, it’s when we really drill down into the data that some revealing patterns emerge. To illustrate this, we use a treemap to display hierarchical data as nested rectangles. In this case, the size of each rectangle corresponds to the total number of premises in each area, while the colour gradient represents the average percentage of premises with gigabit accessibility.
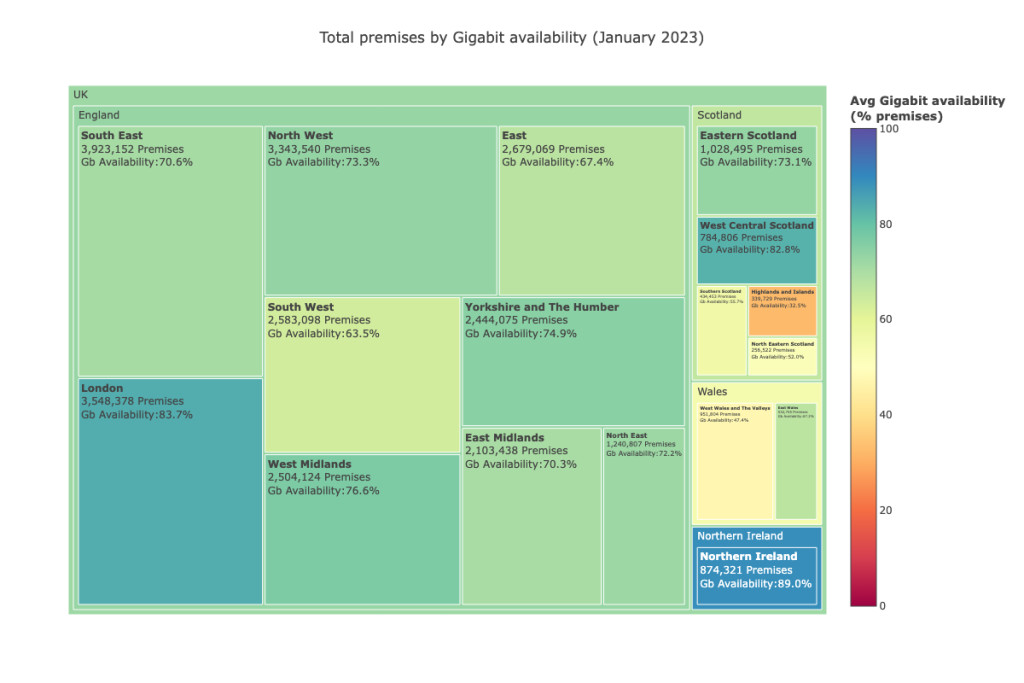
A good example would be to look at Glasgow City. Clicking into Scotland > West Central Scotland > Glasgow City will open the panel to show neighbourhoods aggregated by Middle Super Output Area or Intermediate Zones. This type of boundary is used in the Census to aggregate populations up to 6,000 in Scotland or 15,000 in England.
We can immediately observe the contrast amongst different parts of the city, such as Shawlands East showing gigabit availability rates of 1.5% of premises, while areas relatively close like Pollok North and East are almost fully connected at 99.7%. In short, even in urban areas there can be a big disparity by neighbourhood.
The Urban-Rural Divide
You will no doubt have heard the common discussion on how broadband coverage of rural areas is often lacking. The treemap above reflects that rural areas have lower coverage than their urban equivalents, but how big a difference is there when we look across these by region of the UK? (see note 1).
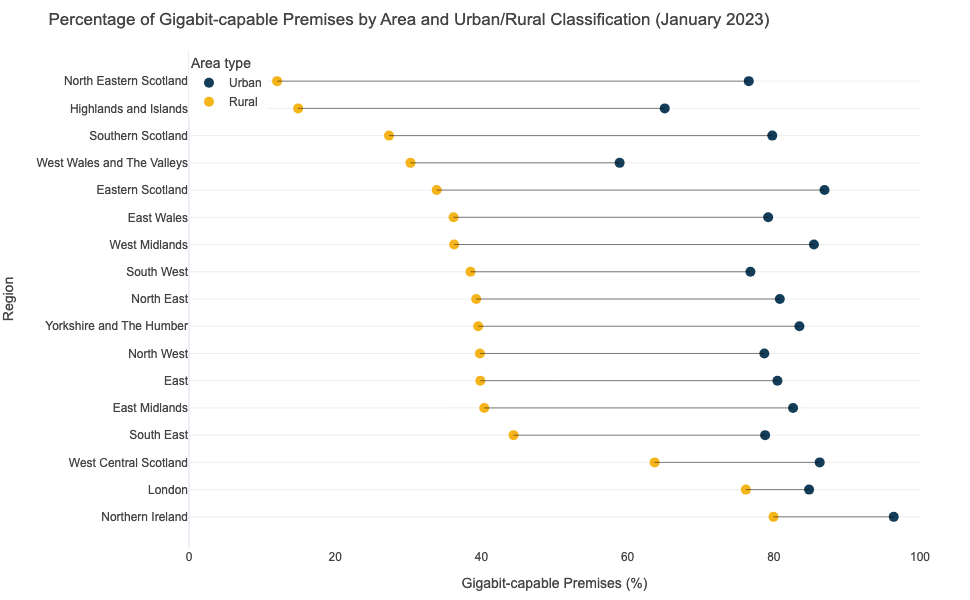
If we look at the two extremes of this chart, rural areas in the North of Scotland are far behind their urban counterparts, whereas in Northern Ireland the gap between urban and rural areas is much smaller. The chart clearly shows that the distribution of gigabit-capable connectivity across the UK is significantly influenced by the urban-rural divide, resulting in a stark difference between areas.
Evolution over time
Now, let’s examine how this landscape is evolving over time to see if the trend in increased gigabit coverage shows progress to address the disparity in rural areas.
Ofcom started reporting on gigabit accessibility in 2020, so we can trace the evolution of availability over the last 3 years, shedding light on the progress made and the challenges that persist.
To visualise this evolution and divergence, an animated bubble plot is the perfect tool. This chart allows us to explore the trend of gigabit availability across the different regions, taking into account the number of homes which is proportional to the population numbers.
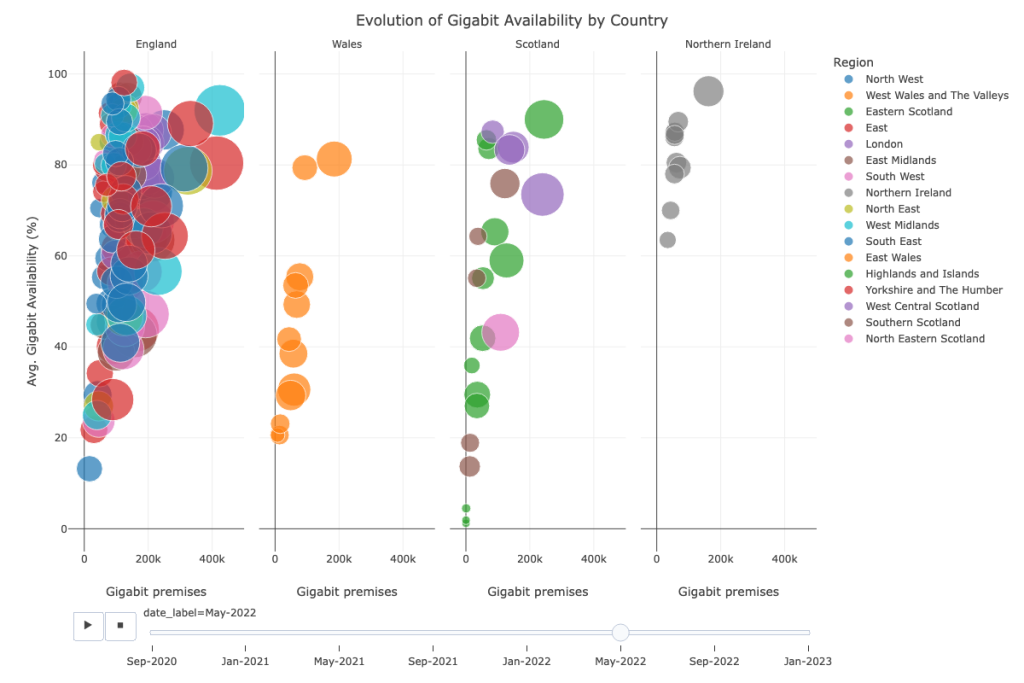
There are a few layers of information summarised in the graphic above:
- Each bubble shows a different county
- Each bubble size is proportional to the Total number of premises available in said county, regardless of their gigabit status.
- Each bubble is colour coded based on the region they belong to
- The horizontal axis indicates the total number of premises with access to gigabit-capable speeds
- The vertical axis shows the % of total premises with access to gigabit speeds. If this value is high, it shows that there are fewer premises left behind.
Some regions have charged ahead, while others appear to be stuck in neutral.
In England, London started in a poor position in 2020, but showed a quick acceleration of coverage in early 2021, followed by only small improvements in the following years. This could imply that there were a large number of quick coverage wins, with less work on addressing the holes in coverage that persist in such urban areas.
Contrast that with a rural area like the North West of England, showing significant progress in some parts but much less so in East and West Cumbria. Or the Scottish Highlands and Islands, where this chart highlights how the island groups are falling behind all other regions of the UK.
Use the chart to explore the trends further for your area or compare with others by selecting regions in the legend to filter by area or using the time slider to focus on a particular date.
What does it mean for me?
It becomes clear that the improvement of gigabit availability has been significant in the last 3 years, with an impressive rate of deployment across the UK. At the same time, this improvement means that there are some areas that are being left behind, without significant upgrades during this time range, so the disparity becomes much more relevant as the time passes.
Understanding these trends and disparities is critical as we aim for more equitable access to high-speed internet, a resource that’s increasingly central to everyday life. Get in touch to learn more about how we could help you identify and map the state of connectivity in your region or industry, and what you could do about it.
NOTES:
1. To classify the premises geographically, we use the UK Composite Urban Rural Classification, a UK-wide dataset that standardises the ONS Rural/Urban Classification (RUC) from England and Wales with the classification in Scottish Government Urban Rural Classification (SGUR) and Northern Ireland’s Delineation of settlements (SDL). These classifications allow us to segregate premises into two broad categories: rural and urban. This distinction provides a comparative overview of the digital divide that exists between the city and the countryside.